Monitor Api Response Time in SprintBoot Using Grafana
API Response time — Response time is the amount of time a system takes to respond to a request once it has received one . For example, the time between the instant we execute an API and this API returns the result of its computation, that’s the response time.
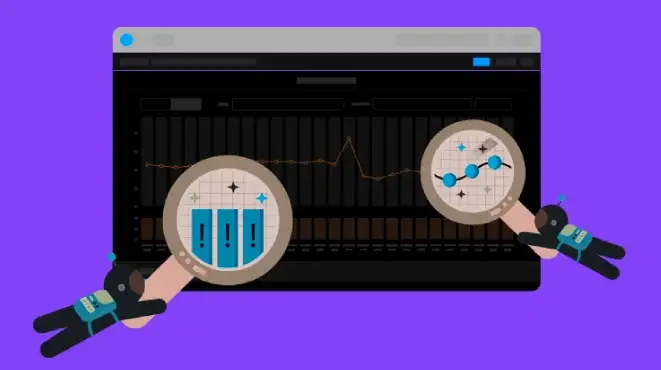
As of today, There are numerous ways to monitor spring boot applications and the API response time. But, Many of the cases when your production environments are running old versions of Spring or there are legacy code where you will not be able to utilise the latest frameworks. You will have to use some custom and efficient ways to monitor the API’s.
Today, Let us look at one of the hacky way to implement the api monitoring in your legacy spring boot application.
Before you Start
Before you start, We expect you to have the following installed in your production environment.
Grafana
Grafana is an open source solution for running data analytics, pulling up metrics that make sense of the massive amount of data & to monitor our apps with the help of cool customisable dashboards
Grafana connects with every possible data source, commonly referred to as databases such as Graphite, Prometheus, Influx DB, ElasticSearch, MySQL, PostgreSQL etc.
Influx DB
InfluxDB is an open-source time series database developed by the company InfluxData. It is written in the Go programming language for storage and retrieval of time series data in fields such as operations monitoring, application metrics, Internet of Things sensor data, and real-time analytics.
If you have a TIG Stack, then you would already have the setup required to do the API Monitoring.
Plan
The plan is to add some piece of java code in your your spring project to monitor all the API calls. When the Monitoring code detects a slow API, It pushes the API Details and its execution time to Influx DB via http. Then we can plot this data in Grafana.

Code
<!-- https://mvnrepository.com/artifact/org.aspectj/aspectjtools -->
<dependency>
    <groupId>org.aspectj</groupId>
    <artifactId>aspectjtools</artifactId>
    <version>1.8.9</version>
</dependency>
And, add the following java code in your project
import org.aspectj.lang.ProceedingJoinPoint;
import org.aspectj.lang.annotation.Around;
import org.aspectj.lang.annotation.Aspect;
import org.aspectj.lang.reflect.MethodSignature;
import org.springframework.stereotype.Component;
import org.springframework.util.StopWatch;

import java.io.DataOutputStream;
import java.net.HttpURLConnection;
import java.net.URL;

/**
 * @author Amith GC
 * https://amithgc.com
 */
@Aspect
@Component
public class LoggingAspect {

    // Minimum time to track (in Seconds).
    // If the execution time is above this, API Call will be logged.
    private static final int MIN_EXECUTION_TIME_TO_TRACK = 5;

    // Your Application Name
    private static final String APPLICATION_NAME = "SAMPLE";

    // Your Database in Influx Database
    private String INFLUX_DATABASE = "monitoring";

    // Replace the IP & Port with your Influx DB IP & Port
    private String INFLUX_URL = "http://10.11.11.11:8086/write?db=" + INFLUX_DATABASE;

   /**
   * Method to Send the Data to Influx DB
   * @param className - ClassName being Tracked
   * @param methodName - MethodName being Tracked
   * @param timeInSec - Method Execution Time (Response Time)
   */
    private void pushDataToInfluxDB(String className, String methodName,
                                    double timeInSec) {
        new Thread(() -> {
            String classMethod = className + "." + methodName;
            String data = "od-execution-time,host=" + APPLICATION_NAME +
                ",classMethod=" + classMethod +
                " value=" + timeInSec;

            try {
                URL obj = new URL(INFLUX_URL);
                HttpURLConnection con = (HttpURLConnection) obj.openConnection();

                con.setRequestMethod("POST");
                con.setRequestProperty("Accept-Language", "en-US,en;q=0.5");
                con.setConnectTimeout(2000);

                // Send post request
                con.setDoOutput(true);
                DataOutputStream wr = new DataOutputStream(con.getOutputStream());
                wr.writeBytes(data);
                wr.flush();
                wr.close();

                // Making HTTP Call
                con.getResponseCode();
            } catch (Exception ignored) {
            }

        }).start();
    }

    // Please use the package which has all of your controllers
    @Around("execution(* com.amithgc.tcpflash.controller..*(..))")
    public Object profileAllMethods(ProceedingJoinPoint proceedingJoinPoint)
        throws Throwable {
        MethodSignature methodSignature =
            (MethodSignature) proceedingJoinPoint.getSignature();

        //Get intercepted method details
        String className = methodSignature.getDeclaringType().getSimpleName();
        String methodName = methodSignature.getName();

        final StopWatch stopWatch = new StopWatch();

        //Measure method execution time
        stopWatch.start();
        Object result = proceedingJoinPoint.proceed();
        stopWatch.stop();

        if (stopWatch.getTotalTimeSeconds() > MIN_EXECUTION_TIME_TO_TRACK) {
            pushDataToInfluxDB(className, methodName, stopWatch.getTotalTimeSeconds());
        }
        return result;
    }
}
Thats it, Just deploy the project. Data should start showing up in the Influx DB.
Now, You can create a chart in Grafana to show this data. Also, You can set alerts in Grafana and let every one know if something is going wrong.